
Every day, the stock market is full of uncertainty. Traders feel a mix of hope and anxiety as they wait for the market to open.
How many trading days in a year and per month are important. What can we glean from analyzing this timeline, and how does it contribute to a deeper understanding of market dynamics?
2024 holds a dynamic financial landscape, brimming with both obstacles and prospects. To navigate this terrain effectively, it is crucial to grasp the yearly ebb and flow of trading days. This knowledge stands as a pivotal foundation for making strategic decisions that can lead to success.
Come on board as we delve into the trading calendar for the upcoming year, analyzing the various elements that will influence the dynamics of each trading day.
TL;DR: How many trading days in a year for 2024?
- 2024, there will be 252 trading days, with June having the fewest at 19 and October boasting the highest at 23.
- On average, each month will have 21 trading days, contributing to a quarterly average of 63.
- Out of 366 days in the year, 104 days fall on weekends (Saturdays and Sundays), during which stock exchanges remain closed. Notably, all ten holidays that result in exchange closures occur on weekdays.
- Additionally, there will be three abbreviated trading sessions: Wednesday, July 3 (the day preceding Independence Day), Friday, November 29 (the day following Thanksgiving Day), and Tuesday, December 24 (Christmas Eve).
What are Trading Days, and How Many are There in a Year?
Definition of trading days
At its core, a trading day is a day when financial markets are open for business. During this period, investors have the opportunity to engage in the buying or selling of various financial instruments such as stocks, bonds, commodities, and currencies. Visualize trading days as the heartbeat of the stock market, where the consistent flow of transactions forms its pulse.
Trading stocks with the assistance of AI stock trading bot involves leveraging advanced algorithms and machine learning to analyze vast datasets, identify patterns, and execute strategic decisions, ultimately aiming to optimize investment outcomes. Click here to read about 10 best AI software for trading stock.
The Regular Beat
Typically, trading days follow the conventional Monday to Friday-schedule, mimicking the standard working week. However, the rhythm may vary depending on the financial market and its operating hours. Understanding the structure of trading days is crucial for investors, as it forms the foundation for planning and executing their investment strategies.
Beyond the Clock
While the conventional understanding of a trading day revolves around daylight hours, the reality is more nuanced. Some markets, especially in cryptocurrencies, operate 24/7, blurring the lines between traditional trading days and continuous market activity. This evolution in the financial landscape challenges traditional norms and adds another layer to the definition of trading days.
Why Does It Matter?
Now that we’ve established what trading days are, why does this concept hold such paramount importance for investors?
1. Timing is Everything
Trading days dictate when investors can actively engage with the market. Understanding these days is crucial for executing timely transactions, responding to market shifts, and aligning investment decisions with the pulse of the financial world.
2. Planning Strategies
Investors craft their strategies based on the ebb and flow of trading days. Whether it’s short-term day trading or long-term investments, the choice of trading days significantly influences the success of these strategies.
3. Market Indicators
The number of trading days in a specific period can also indicate market health and vitality. Analyzing trends over trading days provides valuable insights into market sentiment and potential shifts.
Calculation of trading days in a year
The Baseline
Traditionally, financial markets operate Monday through Friday, constituting a standard five-day trading week. Considering the average 52-week year, the initial calculation yields a theoretical 260 potential trading days.
Excluding Weekends
However, weekends bring a pause to the market’s heartbeat. We subtract two days each week to refine our count, acknowledging that Saturdays and Sundays are not part of the trading action.
Accounting for Special Scenarios
Leap Years
Leap years inject an extra day into the calendar—February 29. Recognizing this anomaly, we adjusted our baseline to account for the additional trading day.
Market Operating Hours
Not all markets adhere strictly to the conventional Monday-to-Friday schedule. Some operate beyond the standard trading hours, introducing an extra layer of complexity. Investors must know the specific operating hours and days for accurate calculations.
The Holiday Factor
Market Closures
Public holidays disrupt the regular trading rhythm by causing market closures. Identifying and subtracting these holidays from the count provides a more accurate representation of the available trading days.
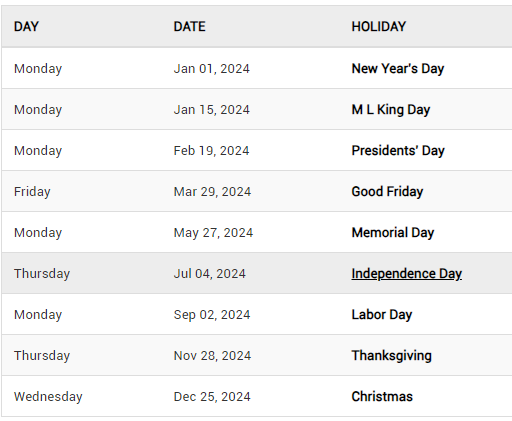
Stock Market Holidays in 2024
Impact of holidays on trading days
Identifying Market Pauses
Public holidays, observed globally or regionally, often lead to market closures. These closures are like a collective pause button pressed across the financial landscape, momentarily halting the usual buying and selling activities.
The Ripple Effect
The impact extends beyond the holiday itself. Surrounding days may witness altered trading volumes and subdued market activity as investors brace for and recover from the market hiatus.
Why Holidays Matter in Trading
Disrupted Trading Rhythm
Market closures disrupt the regular trading rhythm, affecting the usual flow of supply and demand. Investors must factor in these breaks when devising their strategies.
Increased Volatility
As markets resume after a holiday, there is often a surge in trading activity. This increased volatility can present both opportunities and risks, requiring investors to adapt quickly to changing market conditions.
Global Connectivity
In today’s interconnected world, where markets operate globally, the impact of holidays in one region can reverberate across borders. Understanding the global holiday calendar is essential for investors with a diverse portfolio.
Strategies for Navigating Holidays
Planning Ahead
Savvy investors plan their activities around holidays, adjusting their portfolios or executing trades strategically to mitigate potential risks.
Monitoring Market Sentiment
The period leading up to and following a holiday can provide insights into market sentiment. Observing how markets respond to breaks aids investors in anticipating trends.
Diversification as a Hedge
A diversified portfolio can act as a buffer during holiday-related market fluctuations. Spreading investments across different assets helps mitigate the impact of volatility in specific sectors.
Number of trading days in 2024
There will be 252 trading days in 2024, ranging from a minimum of 19 in June to a maximum of 23 in October.
On average, each month will host 21 trading days, contributing to a quarterly average of 63. Among the total 366 days in the year, 104 falls on weekends (Saturdays and Sundays), leading to closed stock exchanges.
It’s noteworthy that all ten holidays prompting exchange closures fall on weekdays. Additionally, there are three shortened trading sessions scheduled for Wednesday, July 3 (the day preceding Independence Day), Friday, November 29 (the day following Thanksgiving Day), and Tuesday, December 24 (Christmas Eve).
How to Calculate the Number of Trading Days?
Within this guide, we will explore the complexities of determining the count of trading days, examining factors that influence this calculation and tackling the distinct challenges posed by leap years..
Weekend Days in Trading Calculations
The typical trading week extends from Monday to Friday, with weekends excluded. In calculating the overall number of trading days, it is essential to factor in weekends, acknowledging that Saturdays and Sundays are designated as non-trading days..
Counting Holidays in the Trading Year
Public holidays introduce breaks in the regular trading rhythm. Including these holidays in the calculation provides a more accurate representation of the actual number of trading days within a given year.
Adjusting for Shortened Trading Days
Certain days, such as the day before Independence Day, the day after Thanksgiving, or Christmas Eve, witness abbreviated trading sessions. Adjusting for these shortened days ensures precision in calculating the total number of trading days.
Factors Affecting the Calculation of Trading Days
The calculation of trading days is impacted by various factors, encompassing the distinct operating hours of diverse markets, regional disparities, and the broader dynamics of global trading. A thorough comprehension of these elements enhances the precision and comprehensiveness of the calculation.
Leap Year Adjustments in Trading Days
Leap years, which occur every four years, introduce an extra day to the calendar—February 29th. Acknowledging and adjusting for this additional day is crucial for precise calculations, especially when determining the number of trading days.
Putting it All Together
Now, let’s walk through a step-by-step guide on how to calculate the number of trading days:
-
Identify the Standard Trading Week: Begin with a standard Monday-to-Friday trading week.
-
Exclude Weekends: Subtract two days for each week to exclude weekends from the count.
-
Consider Holidays: Add or subtract days based on the holidays observed in the trading year.
-
Adjust for Shortened Trading Days: Account for any days with abbreviated trading sessions.
-
Factor in Leap Year Adjustments: If the year is a leap year, incorporate the extra day into the calculation.
Understanding Stock Market Trading Hours
In this comprehensive guide, we’ll explore the regular trading hours, extended and shortened sessions, the nuances of after-hours and pre-market trading, and the impact of trading hours on the overall number of trading days. Furthermore, we will explore the most perilous trading days and hours, offering crucial insights to assist investors in navigating the constantly evolving terrain of the stock market.
Regular Trading Hours for Stock Exchanges
The standard trading hours for stock exchanges delineate the customary window within which financial markets facilitate the buying and selling of diverse financial instruments, including stocks, bonds, and commodities. These hours establish a structured and orderly timetable for market participants to participate in trading activities. Below are essential insights to grasp regarding regular trading hours:
Weekday Operation:
- Regular trading hours typically occur on weekdays, from Monday to Friday.
- The trading day is divided into specific hours during which market activities occur.
Opening and Closing Bells:
- Stock exchanges often commence the trading day with the ringing of an opening bell and conclude it with the ringing of a closing bell.
- The commencement of the trading session is signaled by the opening bell, and the conclusion is marked by the closing bell.
Standard Timeframe:
- While specific hours can vary among exchanges, a common timeframe for regular trading hours is from 9:30 AM to 4:00 PM Eastern Time (ET) for major U.S. exchanges like the New York Stock Exchange (NYSE) and NASDAQ.
Market Breaks:
- There may be scheduled breaks or pauses during regular trading hours, such as a lunch break, depending on the exchange’s rules.
- These breaks provide a brief respite for market participants.
Global Variations:
- Trading hours can vary globally, with different stock exchanges operating in different time zones.
- Investors should be mindful of the operational hours of the particular exchanges they are involved in, particularly in the context of global trading.
Accessible to Retail Investors:
- Regular trading hours are accessible to a broad range of investors, including retail investors, institutional investors, and traders.
Understanding regular trading hours is crucial for investors as it defines the core market activity period. It additionally sets up a standardized framework for executing trades, analyzing market trends, and responding to economic events.
While the foundation of market activity is laid during regular trading hours, it’s crucial to acknowledge that extended and after-hours trading sessions present supplementary opportunities for investors beyond the standard timeframe.
Extended and Shortened Trading Hours
Extended and shortened trading hours refer to deviations from the standard operating hours of stock exchanges, providing investors with additional or reduced opportunities for stock trading. These variations play a significant role in shaping the dynamics of financial markets. Let’s delve into the concepts of extended and shortened trading hours, incorporating relevant keywords for a comprehensive understanding.
Extended Trading Hours:
Extended trading hours extend beyond the regular trading hours established by stock exchanges, allowing trading activities to occur outside the conventional timeframe.
Key Points:
- After-Hours Trading: Extended trading often includes after-hours trading, allowing investors to buy and sell securities after the official market close.
- NYSE and NASDAQ: Major U.S. exchanges like the New York Stock Exchange (NYSE) and NASDAQ provide after-hours trading sessions.
- Market Close Extension: Extended trading hours extend the market close, enabling participants to react to news or events outside regular hours.
- Impact on Trading Days: Extended hours contribute to a potential increase in the number of trading days per year, as trading can occur beyond the standard operating hours.
Shortened Trading Hours:
Shortened trading hours reduce the typical duration of a trading session, often occurring on specific days or occasions.
Key Points:
- Special Sessions: Shortened trading hours may occur on days such as the day before a major holiday, where markets close earlier than usual.
- Exchanges Are Closed: While trading sessions are shortened, it’s crucial to note that exchanges may be completely closed on certain holidays.
- Impact on Trading Days: Shortened sessions contribute to a decrease in the number of trading days per year, as the markets close earlier than usual.
Overall Impact on Stock Trading:
- Extended and shortened trading hours are part of the broader landscape of stock exchange trading.
- They influence the accessibility of markets to investors, impacting the level of liquidity and volatility.
- After-hours trading, in particular, allows for increased flexibility but may carry higher risks due to lower trading volumes.
Understanding these variations in trading hours is essential for investors to navigate the complexities of the stock market effectively. Considering extended and shortened hours, alongside regular trading hours, contributes to a comprehensive understanding of the dynamics that shape the 252 trading days in a typical trading year.
After-Hours and Pre-Market Trading
After-hours and pre-market trading introduces a different dimension to stock transactions. We’ll uncover trading dynamics beyond regular hours, exploring the risks and rewards of these extended sessions.
Impact of Trading Hours on the Number of Trading Days
The impact of trading hours on the number of trading days is crucial for investors navigating the dynamic world of financial markets. The timing of trading hours significantly influences the overall count of trading days in a given period. Let’s delve into the critical aspects of this impact:
1. Extended Trading Hours:
- After-Hours Trading: Extended trading hours, including after-hours trading, allow investors to buy and sell securities beyond the conventional trading day.
- Increased Opportunities: Including extended trading hours increases the number of opportunities for trading within a given year, expanding the overall count of trading days.
2. Shortened Trading Hours:
- Special Circumstances: Shortened trading hours may occur on specific days, such as holidays or special events, reducing the typical duration of a trading session.
- Decreased Opportunities: Shortened trading hours fall the number of opportunities for trading within a specific year.
3. Global Markets:
- Time Zone Variations: Global financial markets operating in different time zones further impact the number of trading days.
- Continuous Trading: With markets in different regions opening and closing at varying times, the potential for continuous trading activities increases.
4. Strategic Considerations:
- Trading Strategy Adaptation: Investors often adapt their trading strategy based on the timing of trading hours.
- Market Analysis: Strategic decisions, analysis of market trends, and execution of trading plans are influenced by the timing of regular and extended trading hours.
5. Market Close Influence:
- Closing Bell Significance: The official closing time marks the end of the regular trading day.
- Post-Close Analysis: Investors may conduct a post-close analysis to assess market movements and make informed decisions for the next trading day.
Understanding the impact of trading hours on the number of trading days is essential for investors seeking to optimize their trading strategies. It involves considering regular trading days, extended trading hours, and potential disruptions due to shortened hours. By navigating these factors, investors can effectively manage risk, seize opportunities, and make informed decisions in the ever-evolving landscape of financial markets.
Riskiest Trading Days and Hours
Navigating the riskiest trading days and hours is a critical consideration for investors aiming to make informed decisions in the dynamic world of financial markets. Understanding when markets are most volatile or prone to unexpected events is crucial for effective risk management. Let’s explore this concept in more detail:
Riskiest trading hours denote specific timeframes during each trading day when markets exhibit increased volatility, potentially leading to abrupt price movements.
Key Characteristics:
- Volatility Peaks: Certain hours witness heightened volatility, marked by rapid price fluctuations and increased trading activity.
- Sensitivity to News: Riskier trading hours may coincide with periods of economic data releases, geopolitical events, or unexpected news, amplifying market uncertainty.
Timing Significance:
- Market Open: The initial moments when the market opens are often considered riskier due to the market’s reaction to overnight developments and news.
- Closing Hours: The final trading hour, especially the last half-hour, can be another period of increased risk as traders position themselves for the close.
Strategies for Mitigation:
- Diversification: A diversified portfolio helps mitigate risks associated with specific trading hours or days.
- Monitoring News: Staying informed about relevant news and economic indicators allows investors to anticipate potential risks during trading hours.
- Risk Management Tools: Utilizing risk management tools, such as stop-loss orders, can limit potential losses during volatile periods.
Continuous Evaluation:
- Adaptive Strategies: Market conditions evolve, and what may be considered a risky trading hour today may change over time.
- Continuous Monitoring: Regularly reassessing and adapting strategies based on market dynamics ensures ongoing risk mitigation.
Understanding the riskiest trading days and hours requires a combination of market knowledge, ongoing analysis, and strategic planning. Investors who are attentive during volatile periods, stay informed about potential risk factors, and continuously refine their approach can better navigate the challenges presented by dynamic financial markets.
Factors Influencing the Number of Trading Days in a Month
Variations in trading days per month
Differences in the number of trading days per month pertain to the changing count of days in a particular month when financial markets are operational for trading. The quantity of trading days may fluctuate monthly due to variables like weekends, holidays, and occasional market closures. Here’s an analysis of the essential components at play:
Weekdays vs. Weekends:
- Trading days primarily occur on weekdays (Monday through Friday).
- Weekends (Saturdays and Sundays) are non-trading days, contributing to the variation in the total number of trading days per month.
Market Holidays:
- National and market-specific holidays can lead to the closure of exchanges, reducing the number of trading days in a given month.
- Different countries and exchanges observe various holidays, adding to the variability.
Shortened Trading Sessions:
- Some days may have shortened trading sessions, impacting the total trading hours and potentially reducing the overall trading activity for that day.
Global Markets:
- Variations can also arise due to differences in time zones and market schedules across global financial centers.
- The interconnectedness of global markets means that events in one region can influence trading activity in another.
Monthly Calendar Dynamics:
- The distribution of weekends and holidays across a month can lead to variations in the total number of trading days.
- Some months may have more weekdays with full trading sessions, while others may have more non-trading days.
Leap Years:
- In leap years, an extra day in February (29th) can impact the total number of trading days for that month.
Trading days in a month during leap years
Trading days in a month during leap years can vary due to an additional day in February. A leap year occurs every four years when an extra day, February 29, is added to the calendar to keep the calendar year synchronized with the astronomical year. Here’s how leap years can impact the number of trading days in a month:
February’s Impact:
- In a standard, non-leap year, February has 28 days, and in a leap year, it has 29 days.
- Adding an extra day in February extends the total number of trading days in that month.
Variations Across Months:
- While February is directly affected by the leap year, other months may experience no change in the number of trading days.
- The number of trading days in months other than February remains consistent between leap and non-leap years.
Global Consistency:
- The impact of leap years is consistent globally, affecting trading days in various financial markets worldwide.
- However, the influence is most noticeable in February due to adding an extra day.
Adjustments for Trading Strategies:
- Traders and investors must consider leap years when planning their activities and strategies.
- The extended trading month in February may provide additional opportunities or require adjustments to trading plans.
Longer Quarterly Periods:
- An extra trading day in February contributes to a more extended quarterly period in leap years.
- Investors may need to account for this when analyzing quarterly performance or making strategic decisions.
Consideration for Monthly Metrics:
- Analysts should consider the influence of leap years on the extended month of February when evaluating monthly performance metrics, such as returns or trading volumes.
Leap years impact the number of trading days in a month by extending February to 29 days. While this addition is specific to February, it can influence quarterly and annual calculations, requiring traders and investors to adjust their strategies and analyses accordingly.
Determining the average number of trading days per month
Calculating the average number of trading days per month entails determining the typical count of days in a month when financial markets are available for trading activities. This computation takes into account diverse factors, including weekends, holidays, and market closures. Below is a detailed, step-by-step explanation of how to ascertain the average number of trading days per month:
Identify the Total Number of Days in the Month:
- Start by identifying the total number of calendar days in the specific month you are analyzing.
Exclude Weekends:
- Eliminate weekends (Saturdays and Sundays) from the total. Financial markets are typically closed on weekends.
Exclude Market Holidays:
- Identify and exclude any market holidays within the month. These are the days when financial markets are officially closed.
Adjust for Shortened Trading Sessions:
- If there are any days with shortened trading sessions, consider them as partial trading days. Adjust the count accordingly.
Calculate the Average:
- Once you have the adjusted count of trading days for the month, you can calculate the average by considering multiple months. Sum up the trading days for the selected months and divide by the number of months.
Formula for Average Trading Days:
Average Trading Days = Sum of Trading Days Across Selected Months/ Number of Months
Considerations:
- While weekdays typically have full trading sessions, it’s essential to consider any variations due to market-specific rules.
- Some months may have a higher or lower trading day based on holidays and their weekly distribution.
- Leap years, with an extra day in February, can impact the average trading days for that month.
Example: Let’s say you analyze trading days for January, February, and March. Suppose January records 21 trading days, February (in a non-leap year) has 20 trading days, and March reports 22 trading days. The average trading days for these three months can be calculated as (21+20+22)/3, resulting in an average of 21 trading days.
Effect of first and last days on monthly trading activity
The first and last trading days of the month often carry unique significance in the financial markets, influencing trading activity, investor behavior, and overall market sentiment. Let’s explore the distinct effects these days can have on monthly trading dynamics:
Effect of the First Trading Day:
Fresh Start and Market Sentiment:
- The first trading day is seen as a fresh start for the month.
- Market sentiment on the first day may be influenced by overnight developments, news, or economic indicators, setting the tone for the rest of the month.
Investor Decision-Making:
- Investors often make decisions based on new information or events outside regular trading hours.
- It is when traders position themselves for potential market trends in the coming weeks.
Volume and Liquidity:
- Trading volumes on the first day may see spikes as market participants act on new information.
- Liquidity can vary, with increased activity as investors adjust their portfolios.
Impact on Short-Term Strategies:
- Short-term traders may be particularly active on the first day, seeking to capitalize on perceived opportunities or reacting to pre-market and after-hours developments.
Effect of the Last Trading Day:
Position Squaring and Profit-Taking:
- The last trading day often witnesses position squaring and profit-taking as traders close out positions before the end of the month.
- Investors may seek to secure profits or limit losses before the monthly close.
Monthly Performance Assessment:
- Investors assess their portfolios’ monthly performance on the last trading day.
- Decisions on portfolio adjustments or rebalancing may be made to align with strategic goals.
Options Expiration:
- Options contracts often expire on the last trading day of the month, contributing to increased activity in the options market.
- This can lead to additional volatility and trading in the underlying securities.
Market Sentiment Shifts:
- The last day can witness shifts in market sentiment as investors position themselves for potential market conditions in the upcoming month.
- Macro-economic factors and geopolitical events can also influence trading decisions.
Overall Considerations:
Calendar Month Closure:
- The first and last trading days mark the opening and closing chapters of the calendar month.
- Monthly closures can influence longer-term investment strategies and decisions.
Impact on Strategies:
- Traders and investors may adjust their strategies based on the specific characteristics of the first and last trading days.
- Strategies may vary, including trend-following, momentum, or contrarian approaches.
Understanding the unique effects of the first and last trading days is crucial for market participants as they navigate the complexities of monthly trading activity. It allows investors to adapt their strategies, manage risks, and capitalize on potential opportunities associated with the distinct dynamics of these key days.
Market conditions impacting trading days within a month
Market conditions are pivotal in shaping the trading dynamics within a month. Various factors, including economic indicators, geopolitical events, and investor sentiment, can significantly impact the frequency and intensity of trading activity. Here’s an exploration of how market conditions influence trading days within a month:
1. Volatility Levels:
- High Volatility: Heightened volatility often leads to increased trading activity as investors respond to rapid price movements and changing market conditions.
- Low Volatility: Low volatility may result in subdued trading activity, with fewer pronounced market swings.
2. Economic Data Releases:
- Major Releases: The release of key economic indicators, such as employment data, GDP figures, or inflation rates, can trigger significant market movements.
- Impact on Trading Days: Trading activity tends to spike around the days when major economic data is scheduled for release.
3. Geopolitical Events:
- Uncertainty Impact: Geopolitical events, such as elections, geopolitical tensions, or policy changes, can introduce market uncertainty.
- Immediate Reactions: Investors may react swiftly to geopolitical developments, leading to increased trading on days when such events unfold.
4. Interest Rate Decisions:
- Central Bank Actions: Decisions on interest rates by central banks can have a profound impact on various financial instruments.
- Scheduled Announcements: Days when interest rate decisions are scheduled often witness heightened trading as market participants position themselves based on expectations.
5. Earnings Reports:
- Corporate Earnings Season: During earnings seasons, companies release their financial results, influencing the prices of individual stocks.
- Increased Stock-Specific Activity: Trading days around earnings reports can experience heightened activity in the stock market.
6. Global Market Conditions:
- Interconnected Markets: Global market conditions, including developments in major financial centers, can influence trading across different time zones.
- Overlapping Trading Hours: Overlapping trading hours between major markets often increases liquidity and trading activity.
7. Market Sentiment:
- Bullish or Bearish Sentiment: A prevailing bullish or bearish sentiment can drive trading decisions and dictate the level of market participation.
- Emotional Responses: Days characterized by extreme market sentiment may witness more emotional responses from traders, impacting trading activity.
8. Technological Advances:
- Algorithmic Trading: The rise of algorithmic trading has altered the frequency and speed of trading activity.
- Impact on High-Frequency Trading: High-frequency trading strategies can increase intraday trading activity.
Understanding how these market conditions influence trading days within a month is essential for investors and traders. It allows for strategic planning, risk management, and the ability to capitalize on opportunities presented by specific market environments. Investors should adapt their approaches based on the prevailing conditions to successfully navigate the dynamic landscape of financial markets.